Exactly What You Get From the
Profit Blueprint

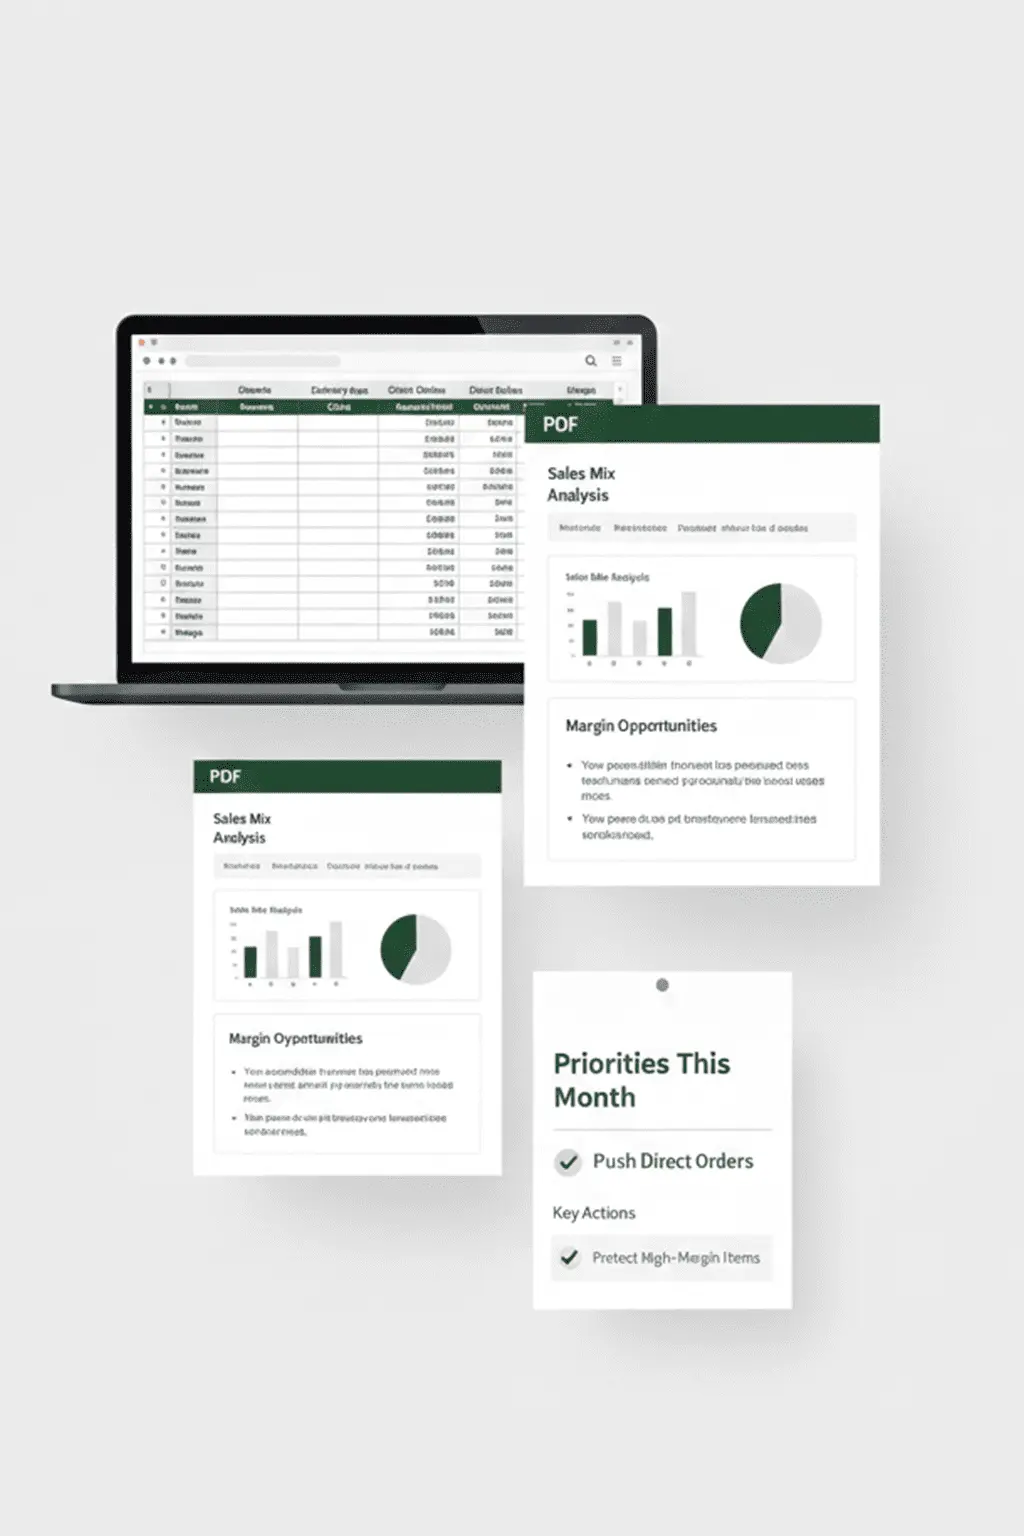
You don’t just get a meeting and some advice. You walk away with three practical tools, built from your actual POS and delivery data: a reusable Excel model, a clear strategy PDF, and a one-page Wall Card your team can act on.

The Engine

A VAT-aware Excel model that shows the real profit picture for your Top 20–25 dishes across Dine-in, Delivery Apps, and Direct.

The Map

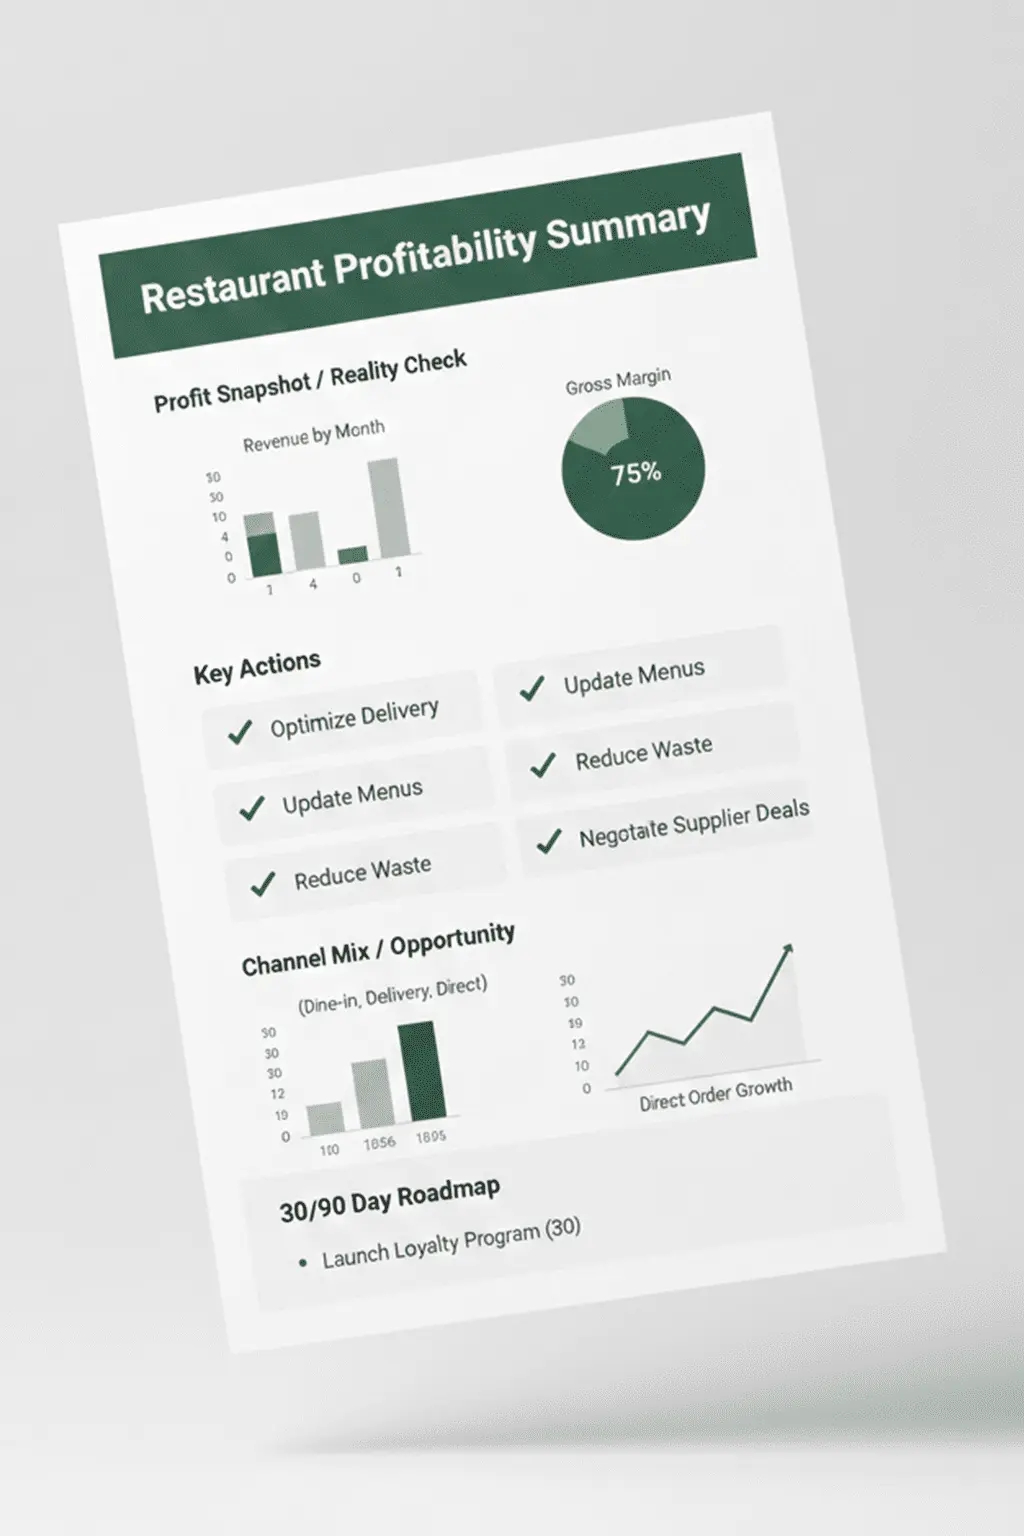
A short PDF that pulls out the key numbers and the 5–7 decisions that matter most.

The Anchor

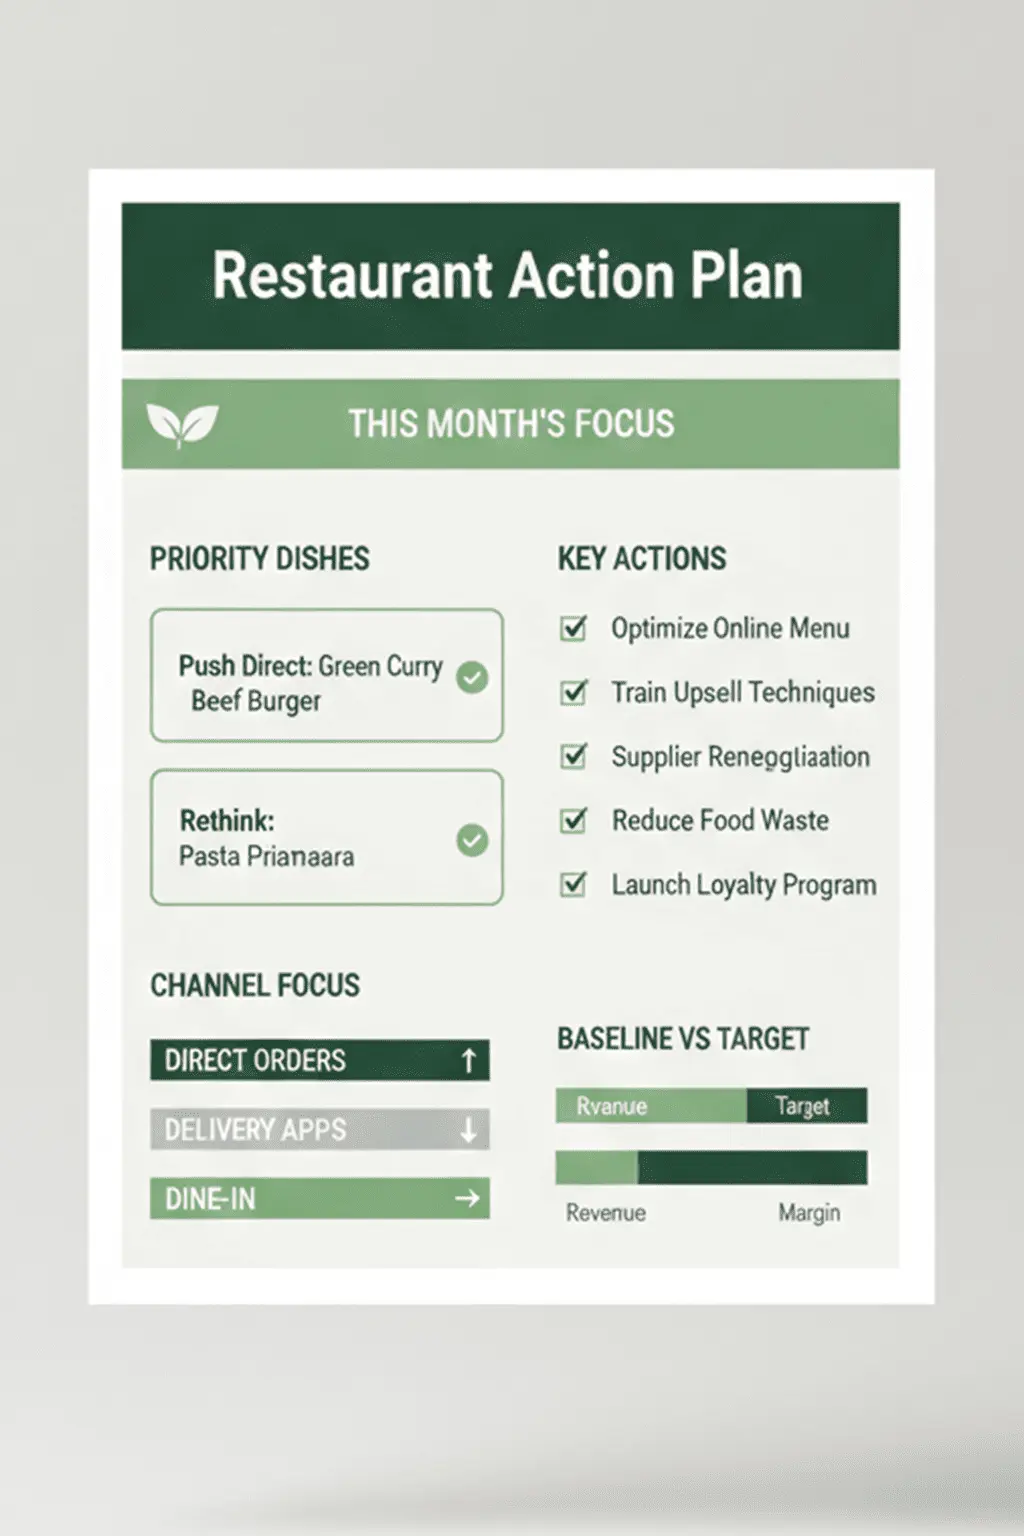
A one-page Wall Card you can pin in your office or kitchen so everyone knows which dishes to push, protect, or rethink.

Overview
Deliverables Snapshot

The Dubai Restaurant Profit Blueprint is a defined project with a defined handover.
When it’s done, you keep three core deliverables that work together:

Excel Model – Your profit cockpit
A working spreadsheet that shows your Top 20–25 dishes by channel, net of VAT, and lets you see the impact of price and channel changes.
PDF Summary – Your decision brief
A short, plain-English overview of where your profit is leaking and the specific actions to address it.
Wall Card – Your daily reminder
A single A4 page you can print and pin, so chefs and managers see the priorities every day without opening a laptop.

Each one is built from your own POS exports, your delivery app statements, and your food-cost estimates.
No generic templates. No theory-only slides.

Deliverable #1
Excel Model

The Excel model is a working file, not a one-time chart for a presentation. We build the structure; you control the inputs. With basic spreadsheet skills, you can keep it up to date whenever your data or menu changes.

Inside the model, you’ll see:
Top 20–25 dishes by channel
For each key item, you can see how it performs on Dine-in, Delivery Apps, and Direct orders.
Net-of-VAT, channel-by-channel view
We use your actual app statements to calculate net rates—stripping out VAT, commissions, and standard platform charges so you see what you actually keep.
Contribution per dish, per channel
You can see which dishes carry the business, which are marginal, and which quietly lose money once all costs are included.
Simple “what if” scenarios
You can test straightforward questions like “What if we adjust this price?” or “What if 10% of these orders move to Direct?” and see the profit impact directly in the model.
Owner-friendly inputs
The cells you touch are limited to things you already know: volumes, food costs, and, when needed, simple assumptions. The formulas and structure sit underneath.
Think of it as your channel and dish-level dashboard. During the debrief, we’ll walk you through which parts to watch and which cells to adjust, so you’re comfortable using it without us.
Excel Model
Deliverable #2
PDF Summary

The PDF summary is designed for a busy owner or manager who doesn’t want to read a 40-page report. It’s a short, focused document you can review in about 15 minutes.

It typically includes:
Your Profit Reality Check
A snapshot of your current channel mix, how much your Top 20–25 dishes contribute today, and where the biggest leaks or opportunities sit.
The "Gap to Direct"
A clear view of what your modelled numbers suggest could be possible in AED terms if you improved your channel mix and pricing.
Top 5–7 actions
A clear table of the specific moves we recommend—around pricing, channel placement, promos, or combos—so you can see, at a glance, what to do first.
30/90-day roadmap
A simple timeline that separates quick adjustments (e.g., a price tweak or menu placement change) from deeper changes that need planning.
The goal is simple: after reading the PDF, you should know what’s going on, what matters, and what to do next—without needing to interpret formulas or raw spreadsheets.
PDF Modal
Deliverable #3
Wall Card

Plans only work if people see them. The Wall Card is a single A4 page designed to live where decisions are made: in the office, near the pass, or by the manager’s desk.

It includes:
Top actions in one table
The same 5–7 key moves from the PDF, compressed into a format your team can scan in seconds.
Baseline vs. target at a glance
Your current Direct share and a practical short-term target you agree at the debrief, so everyone can see the direction you’re trying to move.
Focus dishes
Clear labels for a small set of items—for example, “Push on apps”, “Push Direct”, or “Protect margin”—to guide daily decisions about promos, upselling, and menu placement.
Simple prompts for briefings
Enough information for a manager or chef to use in pre-service huddles or weekly meetings without needing to open the full model.
You don’t need to explain the whole Blueprint to every staff member. The Wall Card gives them the short version: which dishes matter most, and what you want to happen with them.
Wall Card
Long-Term Value
How to Use Each Month / Quarter

Once the project ends, these files are yours. You can use them to steer the business over long term, provided you keep feeding them real numbers.

Monthly
Quick Updated
Around 10-15 minutes
  • Pull fresh POS exports for your Top 20–25 dishes and update volumes in the Excel model.
  • Update food costs for any items where ingredient prices have clearly changed (for example, chicken or oil prices spike).
  • Glance at the Wall Card and the model to see if orders are shifting in the right direction across Dine-in, Apps, and Direct.
Quarterly
Deeper Check-in
30–45 minute review
  • Revisit the Top 5–7 actions from the PDF and Wall Card to see what’s been implemented and what’s pending.
  • Check whether your Direct share and overall contribution on key dishes are moving toward the targets you agreed at the debrief.
  • Determine if you want a short review call with us or if you’re happy running DIY.

The intent is simple: a few minutes of updating each month, a slightly deeper check-in each quarter, and tools that keep working as long as you keep feeding them real numbers.

Important
Boundaries / What This Is Not

To avoid confusion, here’s what these tools are not:

Not a statutory or tax audit
The Excel model and PDF are for decision-making, not for filing returns or satisfying regulatory requirements.
Not a full recipe or inventory system
We focus on best-estimate food costs for your Top 20–25 dishes, not gram-by-gram costing for every item.
Not a replacement for your accountant or full P&L
These tools sit alongside your existing financials and help you see where the P&L results are coming from at dish and channel level.
Not a compliance or food-safety certificate
We rely on the data and estimates you provide; we do not certify records or operational compliance.
Not a “set and forget” guarantee
The outputs stay useful as long as you keep the inputs (sales, costs, channels) reasonably up to date.

They are built to support clearer decisions on dishes, prices, and channels—not to replace the formal financial and compliance work your accountant already does.

FAQ
Frequently Asked Questions

No. If you can open a file, change a few numbers, and read rows and columns, you’re fine. The structure and formulas are already built; we’ll show you which cells to update and which views to look at during the debrief.

It’s designed for them. The Wall Card translates the core decisions into a one-page view that chefs and managers can refer to during pre-service briefings, shift handovers, or weekly meetings—without logging into anything.

A quick monthly update (updating volumes and key costs) is enough to keep the insights reasonably fresh over time. A deeper look every quarter helps you decide if it’s time to adjust prices or menu positioning again.

The model is flexible. You can type over old item names with new best-sellers and update the costs. The file is a template you can reuse as your menu evolves.
Ready to See Your
Profit Picture Clearly?

If these tools sound like something you and your team would actually use,
you can book a quick fit call from the main Blueprint page whenever you’re ready.